
SwissWelle sells Boho clothing, jewelry and homeware to Swiss shoppers, running WooCommerce on WordPress. The store looked healthy and scored 59 on mobile PageSpeed.
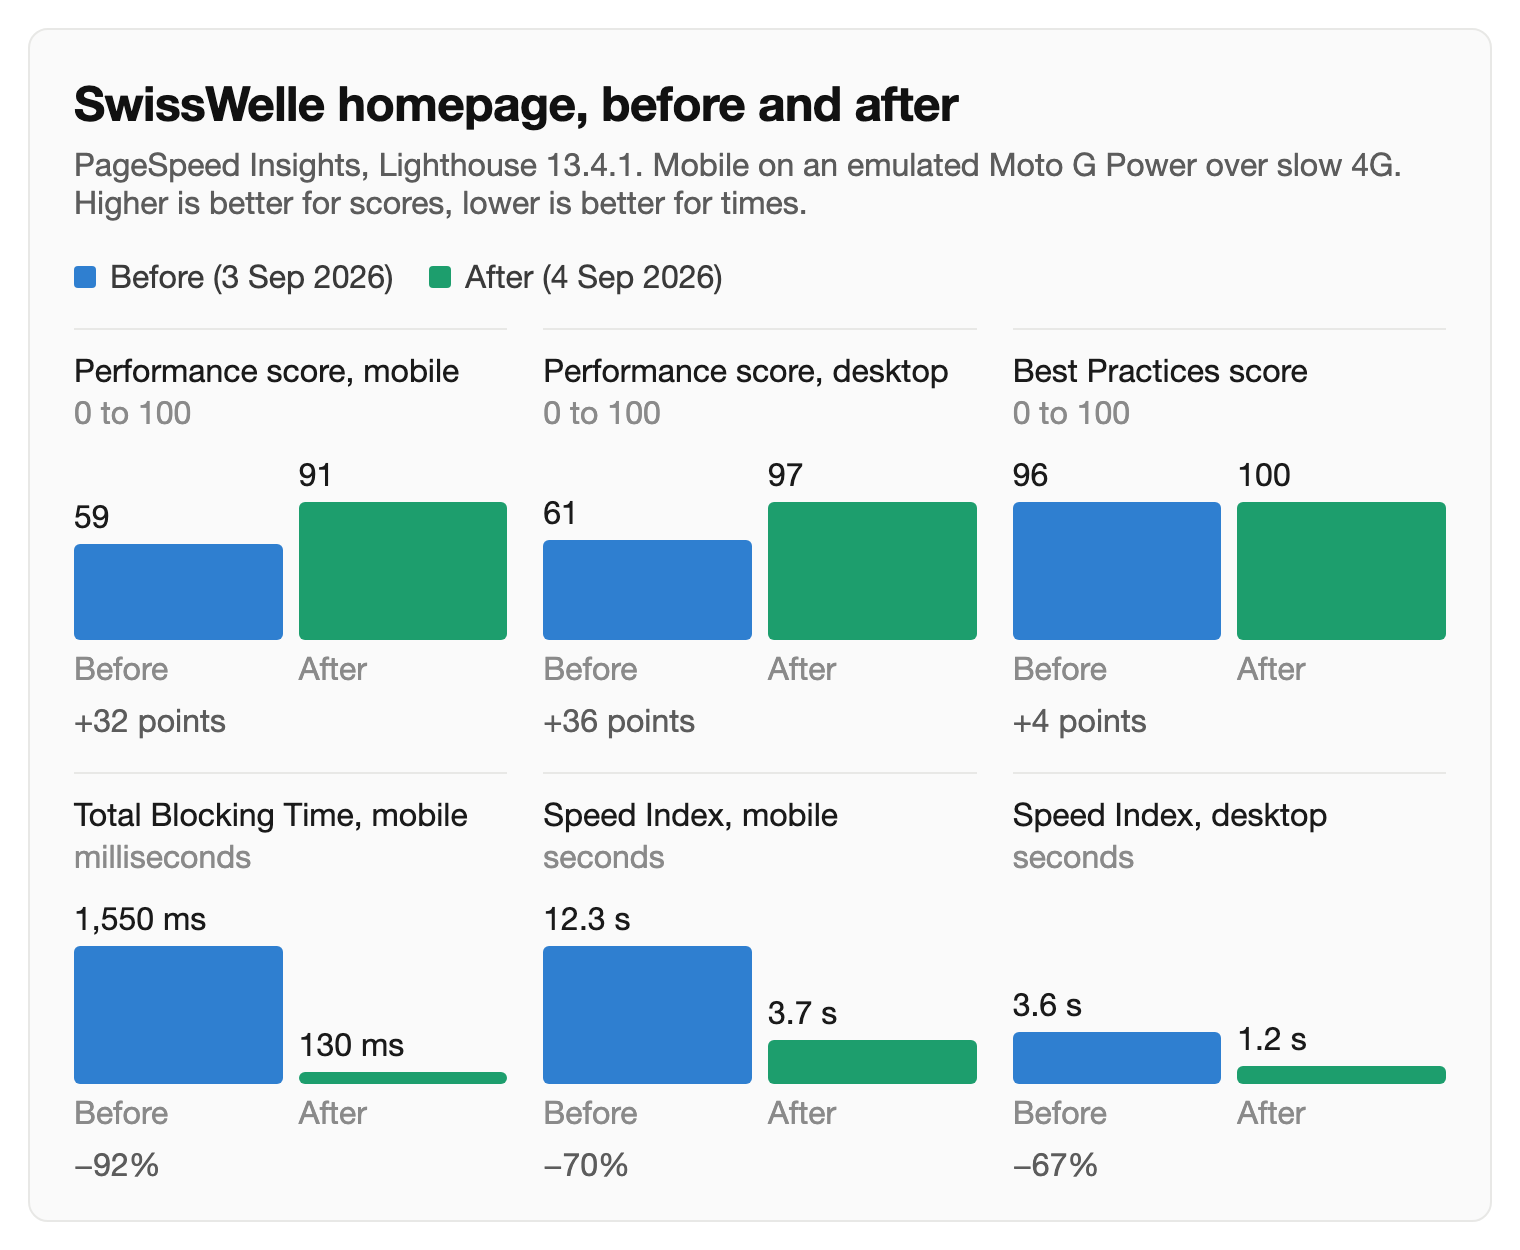
We spent an evening on it. Mobile finished at 91, desktop at 97, and the homepage lost about two thirds of its weight.
| PageSpeed Insights, homepage | Before | After |
|---|---|---|
| Performance, mobile | 59 | 91 |
| Performance, desktop | 61 | 97 |
| Total Blocking Time, mobile | 1,550 ms | 130 ms |
| Total Blocking Time, desktop | 1,430 ms | 130 ms |
| Speed Index, mobile | 12.3 s | 3.7 s |
| Speed Index, desktop | 3.6 s | 1.2 s |
| Best Practices | 96 | 100 |
Both tests ran in PageSpeed Insights on Lighthouse 13.4.1, mobile on the emulated Moto G Power over slow 4G. Same tool, same page, a day apart.
The score pointed at images. Images were not the problem.
Desktop painted its largest element in 0.8 seconds and still scored 61. That combination rules out the usual suspects, because when the biggest thing on screen arrives in under a second and the score stays low, the browser is busy rather than waiting.
Total Blocking Time was 1,550 ms on mobile and 1,430 ms on desktop. A slow connection does not produce two numbers that close together on such different devices, but slow JavaScript does.
What a real measurement found
Our first pass counted the bytes of everything written into the HTML: 533 KB of JavaScript across 63 files, 54 of them blocking the first paint, plus 38 stylesheets.
That count was wrong, and the way it was wrong is worth explaining. It only sees files the HTML names, so it cannot see a script that loads another script. Lighthouse’s network log described the same page very differently.
| Loaded on the homepage | Transferred | Share of page |
|---|---|---|
| Stripe | 1,925 KB | 45.8% |
| hCaptcha, pulled in by Stripe | 750 KB | 17.8% |
| Everything the store serves itself | 1,141 KB | 27.1% |
| Google tags | 318 KB | 7.6% |
| Total | 4.11 MB |
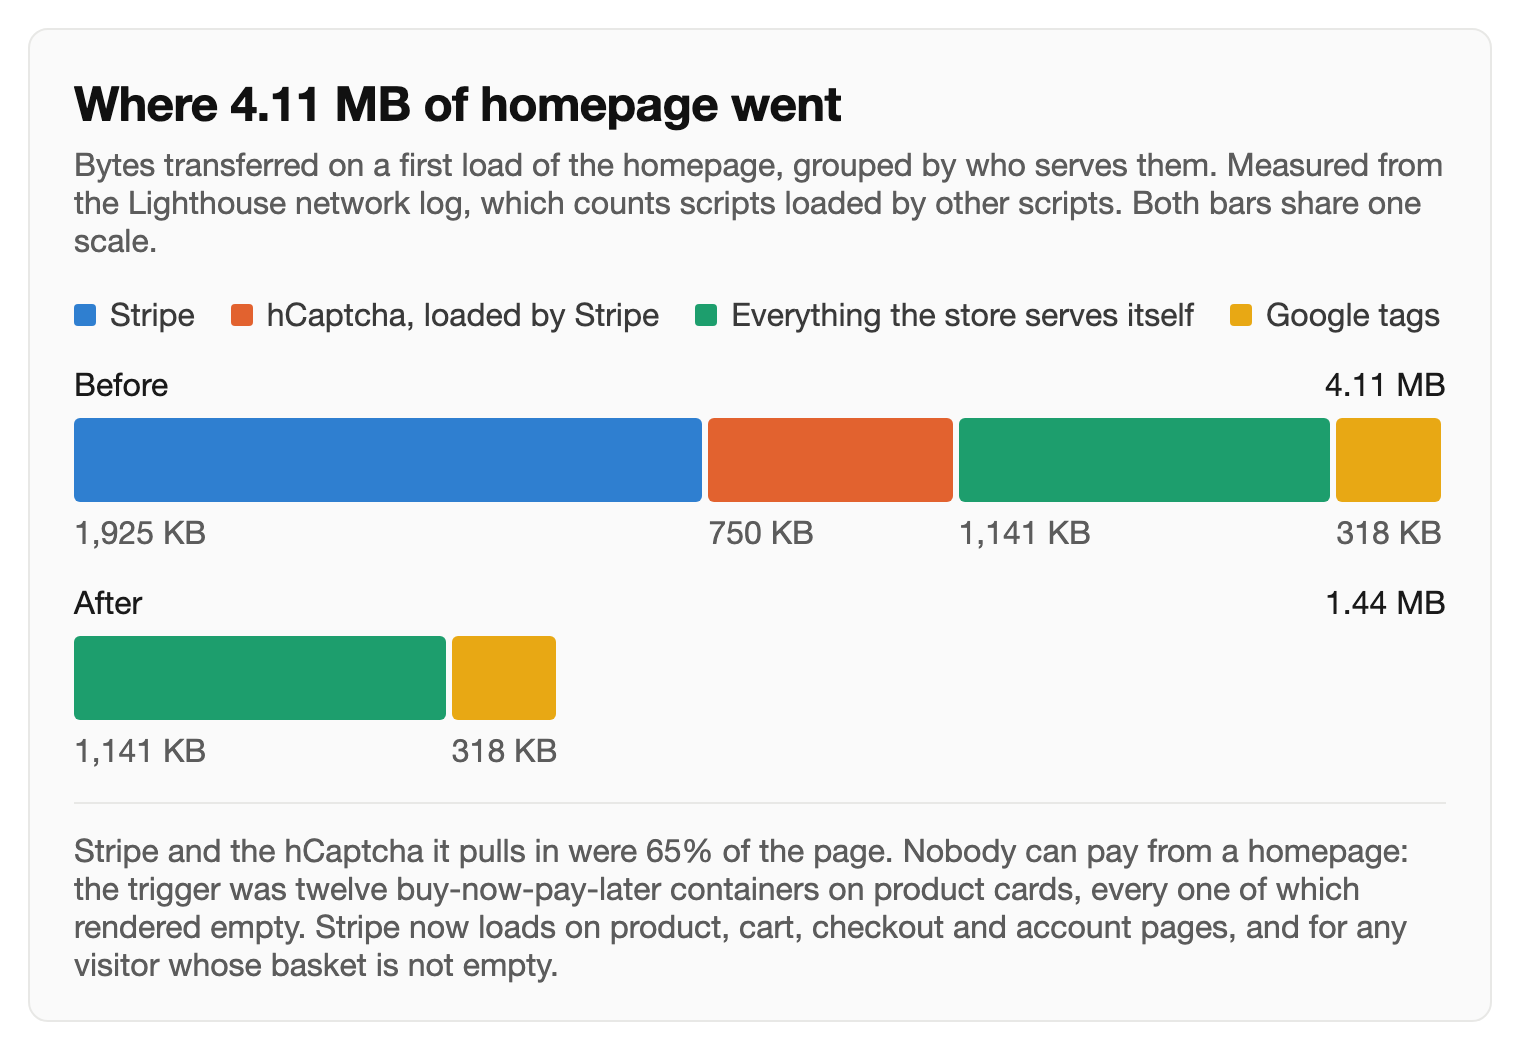
Two thirds of the homepage was payment infrastructure, on a page with no checkout. The store’s own HTML, CSS, images and scripts together came to less than a third of what visitors downloaded.
Why it was there
The Stripe plugin puts a “buy now, pay later” message on product cards. Twelve of those containers sat on the homepage and five more on a product page.
Every one of them rendered empty. We checked the live DOM rather than the source and found zero characters of visible output. All three BNPL gateways already had messaging switched off in their own settings. The plugin emitted the containers and loaded the entire Stripe stack anyway, and Stripe loaded hCaptcha behind it. So the store was carrying 2.7 MB to display nothing.
The work, and what each piece returned
None of this is exotic, and none of it is specific to this store. It is the ordinary shape of a WordPress speed optimization job, and the order mattered more than any single item on it: two of these changes only made sense once the measurement was right.
Page cache at the web server
WordPress rebuilt the whole page from PHP and MySQL on every hit. No cache plugin was installed, and the response headers said no-cache, so Cloudflare would not hold the HTML either. Time to first byte measured 1.30 to 1.49 seconds, over and over.
We put an nginx fastcgi_cache in front of PHP, which took time to first byte down to 0.31 to 0.39 seconds. That is roughly four times faster on every page a logged-out visitor sees.
Writing the bypass rules took longer than installing the cache. This store’s checkout lives at /kasse/, not /checkout/, and every copy-paste WooCommerce cache recipe on the internet excludes /checkout/. Pasted here, it would have cached the live checkout page and served one shopper’s basket to the next person who arrived.
Cart, checkout, account, and anyone holding a WooCommerce cart or session cookie now bypass the cache and go straight to PHP.
Ad traffic was excluded from the cache we had just built
Our first version skipped the cache whenever a URL carried a query string. That is the common rule, and on this store it was expensive. SwissWelle runs Google Ads and Google Shopping, so its paid visitors arrive on ?gclid=, ?srsltid= and ?utm_source=. The people the store pays to attract were the only ones guaranteed to miss the cache.
A URL whose query string holds nothing but tracking parameters is now cached under its bare path. The parameters still reach the browser and still reach analytics. They just no longer split the cache into thousands of single-use copies.
Stripe, scoped to pages where money changes hands
Stripe now loads on single products, the cart, the checkout and the account pages, and for any visitor whose basket is not empty. Everywhere else it does not load.
The homepage went from 4.11 MB to 1.44 MB. Stripe and hCaptcha dropped from 2,675 KB to zero on listing pages, and mobile Total Blocking Time fell from 1,550 ms to 130 ms.
Shoppers with something in their basket keep every payment feature. They also bypass the page cache, so the two rules agree with each other instead of fighting.
Image widths that matched the layout
Product cards sit two to a row on a phone, 181 CSS pixels wide, while their sizes attribute claimed 300 pixels. Overstating by 65% pushed the browser past the 441-wide file in the srcset and onto the 768-wide one: 114 KB where 40 KB would have done, seventeen times over on a single page.
The same fault sat on the logo, which was shipping its full 1246-pixel original into a slot that CSS renders 85 pixels tall.
Wasted image bytes fell from 919 KB to 341 KB. We re-cut no images and installed no plugin. The right files already existed and the markup was pointing at the wrong ones.
Icon fonts with nothing to draw
Elementor loads Font Awesome and its own eicon set on every page. We counted the elements using either one across the homepage, the shop, a product page and the contact page, and the answer was zero every time.
Stylesheets went from 38 to 34 and CSS from 79 KB to 56 KB, with three fewer files blocking the first paint.
Two copies of the same Google library
Site Kit loaded gtag.js for the GA4 tag. Google for WooCommerce loaded gtag.js again for the Ads tag. It is one library, so once it is on the page a second gtag('config', …) call runs on the copy already there.
We removed the duplicate loader and left both configurations intact. The guard matters more than the saving here: the loader is only stripped when a Google tag is genuinely present in the same page, so switching Site Kit off can never take Ads tracking down with it.
The size of this one deserves precision. The duplicate download disappears from the HTML, but gtag then fetches the Ads configuration itself at around 145 KB, so the bytes largely come back. What is saved is a second parse and execute of a large library, which is the thing Total Blocking Time measures.
Consent Mode was running in the wrong order
This is not a speed fix. We found it while tracing the tags and thought it worth stopping for.
The store’s only gtag('consent', 'default', …denied…) was printed near the end of <head> by Google for WooCommerce. Site Kit had already run its GA4 config about 37,000 bytes earlier in the same document.
The dataLayer is processed in order, so GA4 was being configured before the denied defaults were declared, for a region list that includes Switzerland and the EU. The same defaults now run first, ahead of every tag.
An optimization module from 2020
The server was running ngx_pagespeed. Google discontinued it in 2020 and it has had no security updates since. It was rewriting every page, with image lazy-loading and inline blurry previews switched on.
We turned it off, then tested the decision instead of assuming it.
| Same Lighthouse, module toggled | Off | On |
|---|---|---|
| First Contentful Paint | 3.5 s | 4.2 s |
| Largest Contentful Paint | 4.2 s | 5.4 s |
| Speed Index | 7.5 s | 5.4 s |
Off wins on both paint metrics. On wins only Speed Index, which is what an inline blurry placeholder is built to flatter: the metric registers paint, the shopper sees a smudge, and the real image still arrives late.
Where the store landed
| Measured | Before | After |
|---|---|---|
| Mobile PageSpeed | 59 | 91 |
| Desktop PageSpeed | 61 | 97 |
| Mobile Total Blocking Time | 1,550 ms | 130 ms |
| Mobile Speed Index | 12.3 s | 3.7 s |
| Desktop Speed Index | 3.6 s | 1.2 s |
| Time to first byte, repeat visit | 1.30 to 1.49 s | 0.31 to 0.39 s |
| Homepage weight | 4.11 MB | 1.44 MB |
| Third-party payment code on listing pages | 2,675 KB | 0 KB |
| Wasted image bytes | 919 KB | 341 KB |
| Best Practices score | 96 | 100 |
Accessibility held at 97 on mobile and 93 on desktop, SEO stayed at 100, and Cumulative Layout Shift did not move because it was already good.
Nothing was rebuilt. The theme, the plugins and the design are untouched, and every WordPress-side change lives in one file we can delete to put the store back exactly as it was.
What this store teaches other stores
Check what a page actually loads rather than what its HTML says it loads. Our own first measurement missed the largest fact about this site by a wide margin, because scripts that load other scripts are invisible to anything reading only the source. If you are commissioning a website audit, ask whether it reads the network log or only the score.
Payment plugins do not police themselves either. Stripe, PayPal and BNPL messaging tend to load everywhere by default, and on a catalogue page they buy you nothing. It is worth checking on any WooCommerce store that has a payment plugin installed, whether or not the store feels slow.
Be careful with cache rules copied from a tutorial, because they assume your slugs. This checkout was in German, and the standard rule would have cached it.
Finally, Speed Index can be improved dishonestly. Any tool that paints a placeholder early improves that number without improving the experience, so compare LCP before believing a Speed Index win.
What we have not finished
Largest Contentful Paint on mobile sits at 2.7 seconds, bound by First Contentful Paint at 2.3 seconds. Behind that are 34 stylesheets and 48 render-blocking scripts still queued ahead of the first pixel. Cutting that list is the next job and the riskiest one so far, so it happens with the store owner’s agreement rather than as a surprise.
Several product images are still JPEG where WebP would cut them further.
Scope: one evening. Stack: WordPress, WooCommerce, Shoptimizer, Elementor, nginx, Cloudflare, Redis. Rollback: a full file and database backup was taken before the first change and verified by checksum.